Data Masking Reports
When execution is completed, the user can analyze the masking reports by different criteria:
Processing Insights and Troubleshooting Insights are critical components of the execution where key information about the execution process is stored.
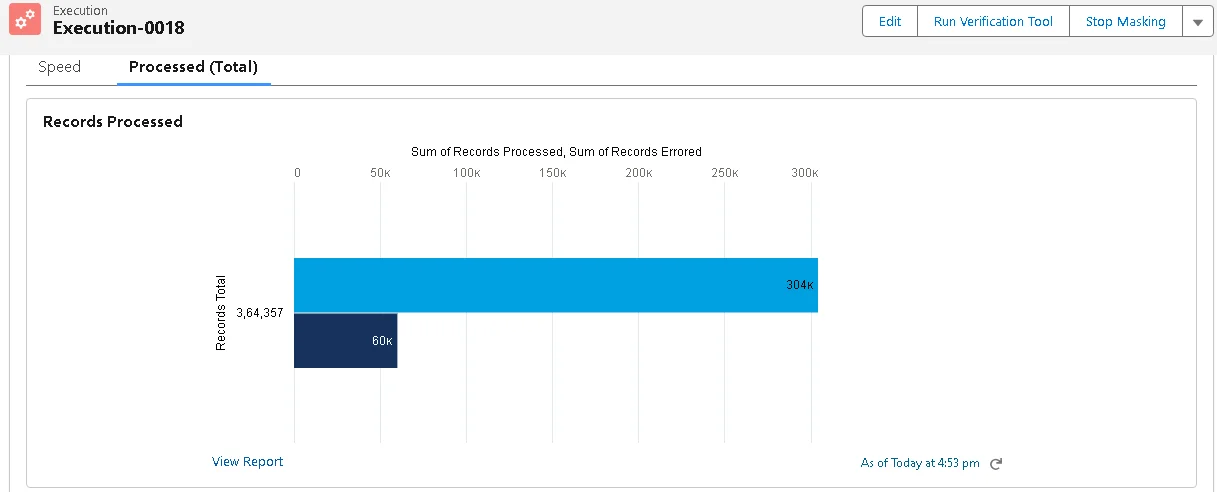
This feature allows users to monitor and assess the overall speed of DataMasking operations, providing valuable metrics on performance, including total records masked, total records errored, etc.
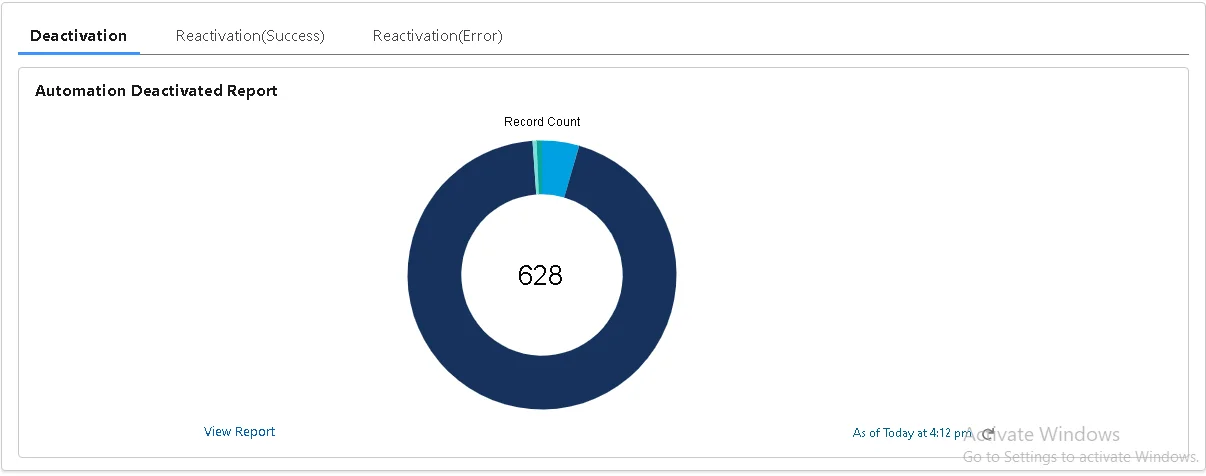
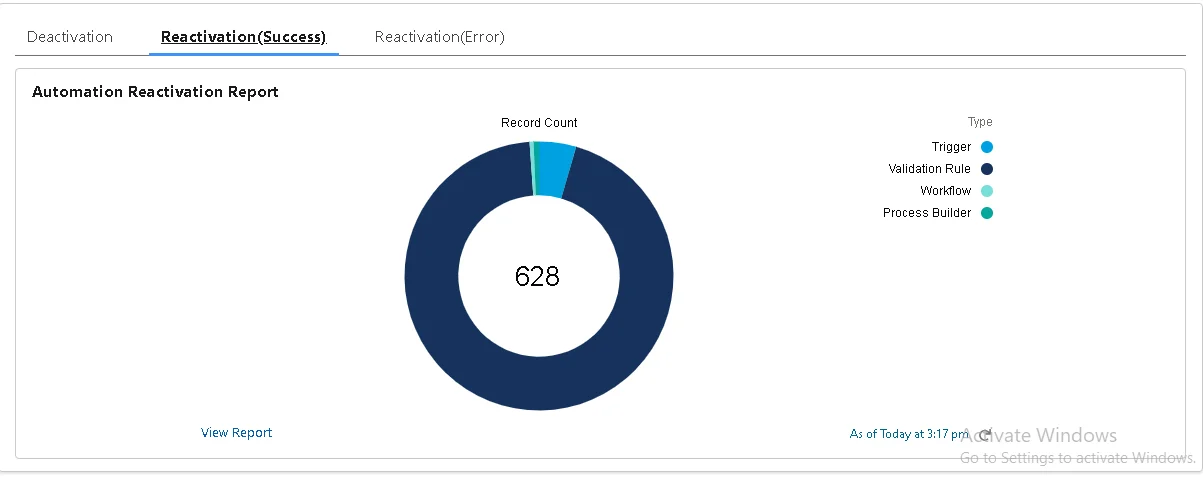
Additionally, Processing Insights generates detailed reports on the deactivation and reactivation of automation processes, enabling users to track these activities comprehensively.
If there are any issues during the reactivation process, these insights help in identifying and troubleshooting the problems efficiently.
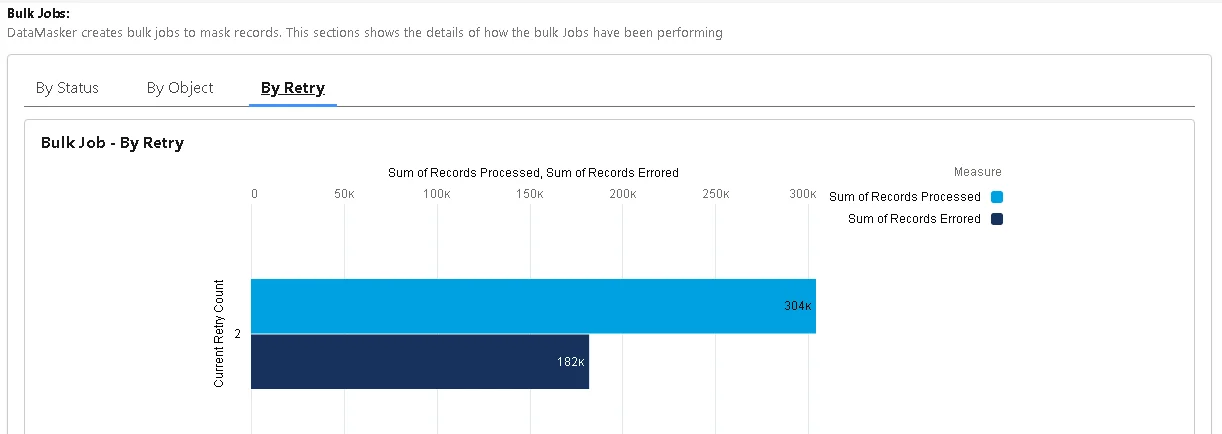
- Processed total:- This bar graph shows the sum of records processed and the sum of records errored in that particular execution.
- Automations: DataMasker automatically deactivated and reactivated Automations(Triggers, Validation Rules, etc.). This section shows the details of activations.
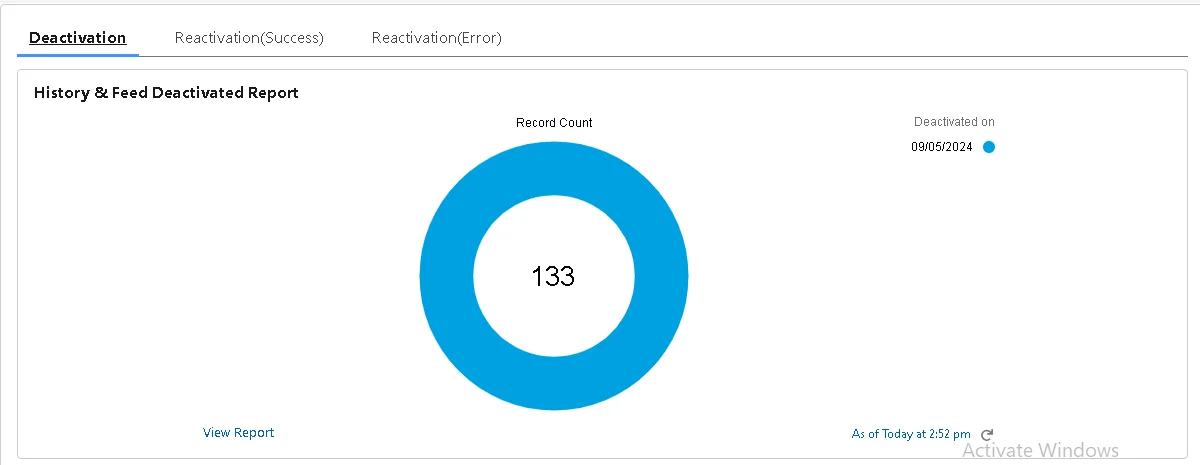
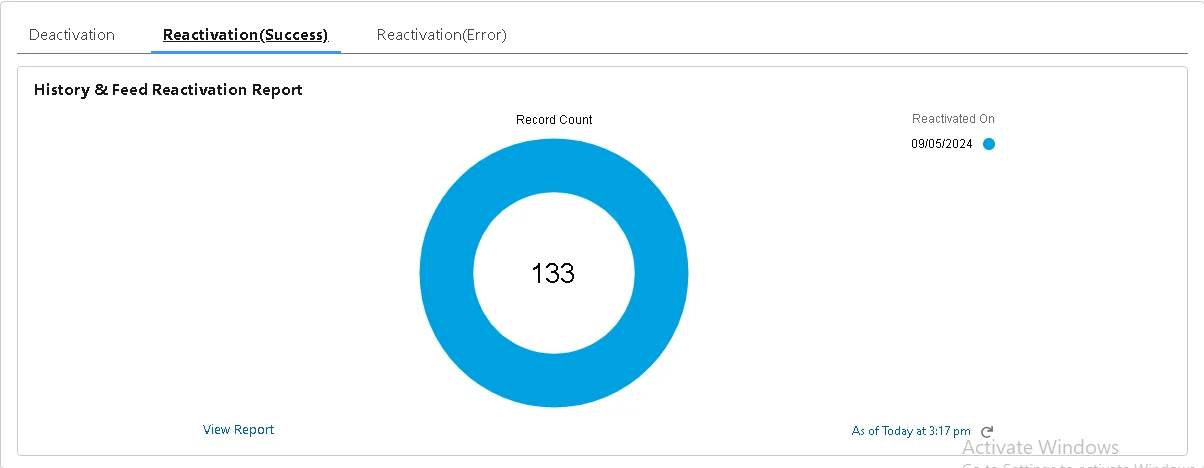
- History/Feed Tracking Deactivation/Reactivation: DataMasker automatically deactivated and reactivated History and Feed tracking before the masking happens. This section shows the details of activations.
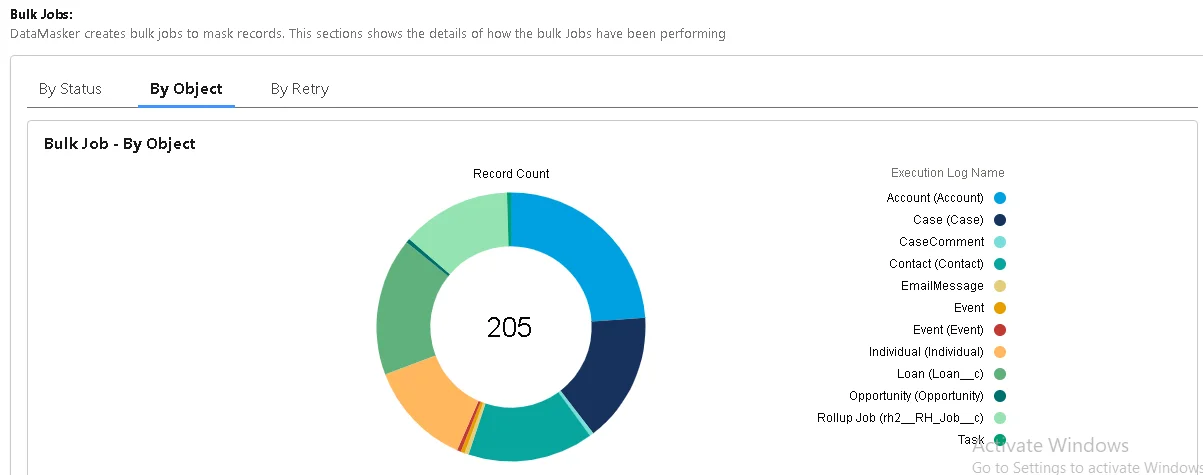
- Bulk Jobs Reports: DataMasker creates bulk jobs to mask records. This section shows the details of how the bulk Jobs have been performing and the status-wise reports for the data that is masked.

- Exception Logs: DataMasker captures exception records in this object. The DataMasker support team may need this information.
The Exception Logs section helps in identifying and categorizing exceptions encountered during the masking process. By leveraging this feature, users can diagnose and resolve exceptions, allowing for the reinitiation of masking operations. Additionally, users can view detailed exception reports for comprehensive analysis and troubleshooting.
Need Help?
If you have questions about this documentation, please contact our support team.