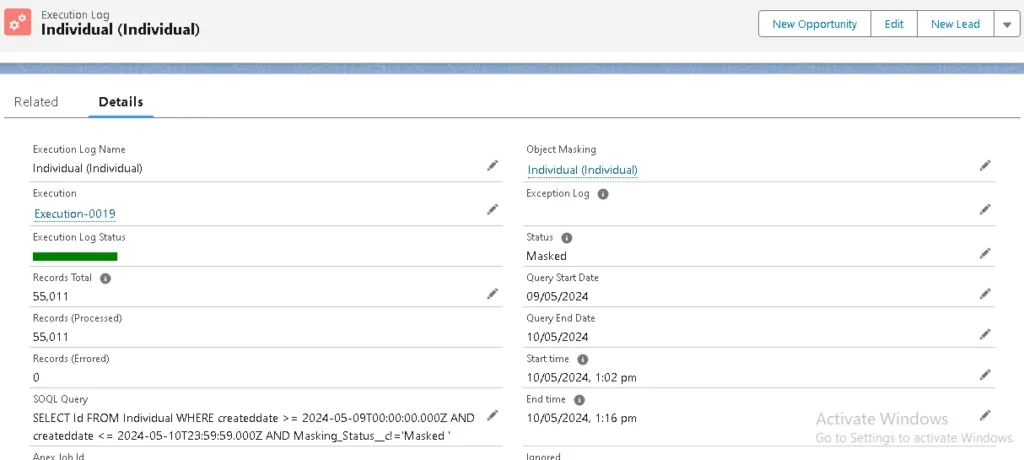
Execution and Logs keep track of DataMasker’s performance at a high level (‘Execution’) and a detailed level (‘Execution Log’).
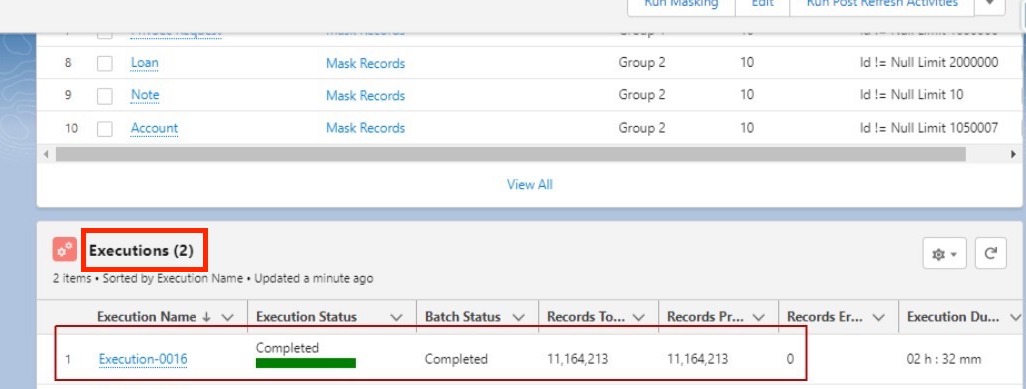
To check the execution, click on the “Executions” tab, and the user can see the list of executions.
Open the most recently completed Execution.
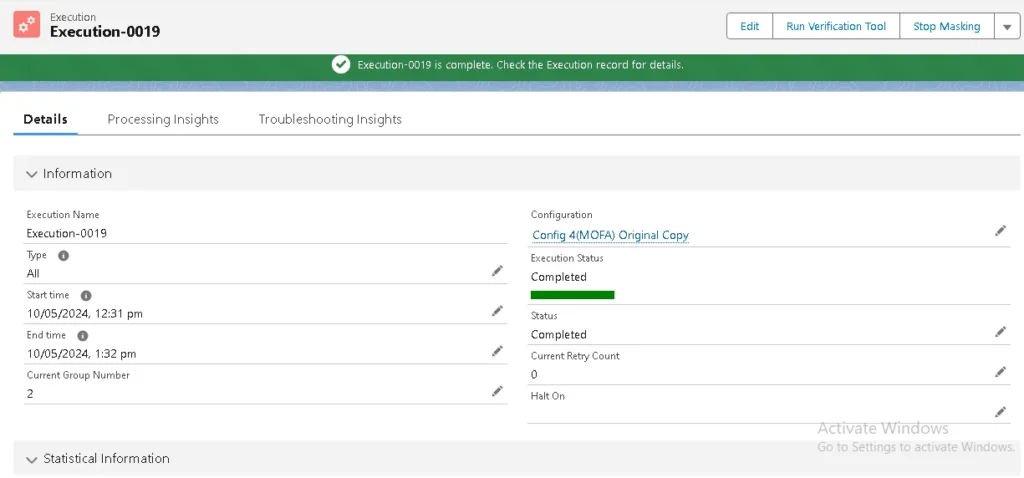
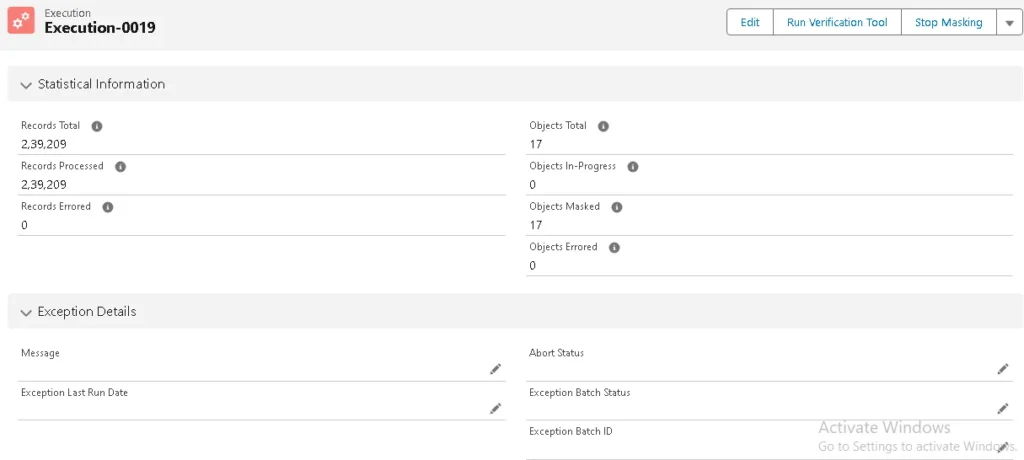
After clicking on the Execution tab, it will display the Execution Details page
The master object summarizes all Execution Logs of the executed Data Masking Configurations.
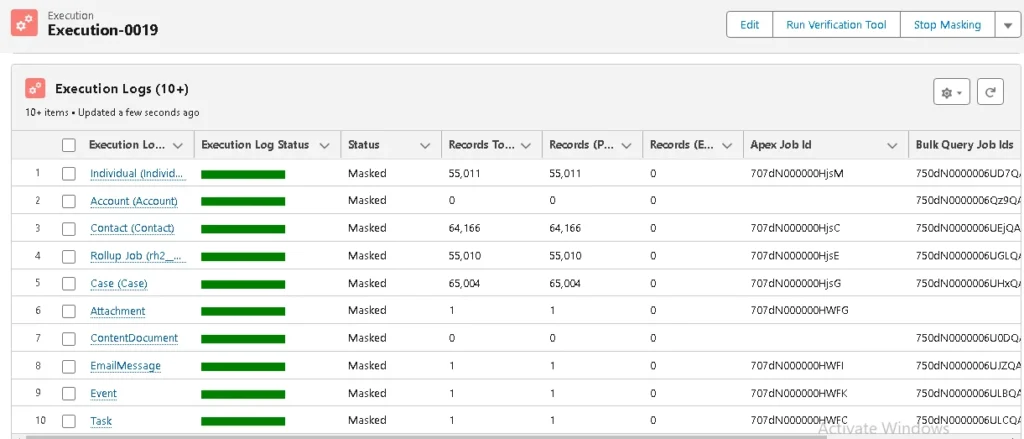
Execution Log
Now, click on any object name from the Execution Log – it will show detailed information for that single object.
Here we click on “Individual” and it will show the object performance details.
Users will find all statistics and Execution Log status here.
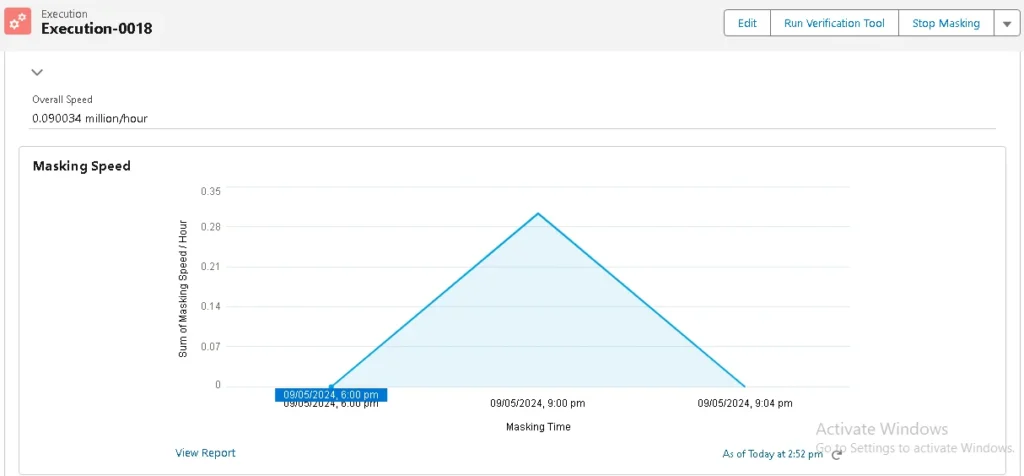
Overall speed of the Execution:
When the execution is completed, users can see the overall speed of the execution, which is millions per hour. The Processing insights tab shows the overall speed details.
Masking speed (X hour interval in millions)
This masking report shows the masking speed as per million records in every 3 hours.
By analyzing the graph statistics, users can easily determine the speed at which the masking is running.
The period value is set in custom metadata, which can be changed according to user needs.
The above chart represents the value of speed calculated by a formula field called ‘masking speed’ for every three hours. When the masking ends, the value of speed also touches 0.


