Execution and Execution Logs keep track of DataMasker’s performance at a high level (‘Execution’) and a detailed level (‘Execution Log’).
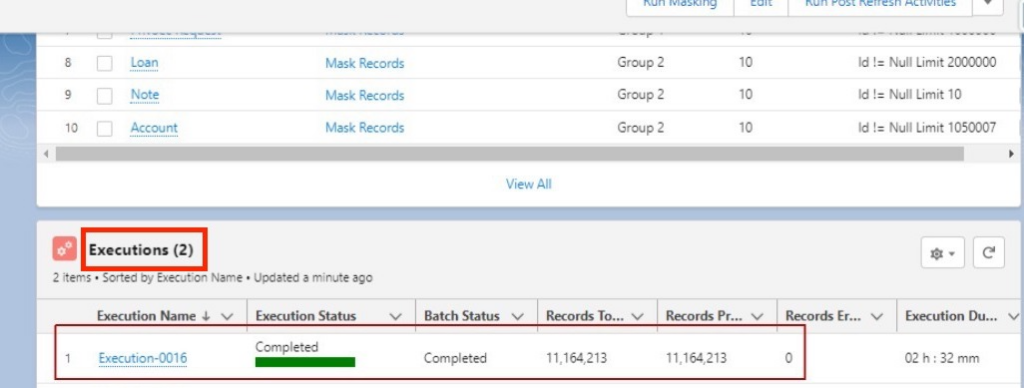
To check the execution, click on the “Executions” tab, and the user can see the list of executions.
Open the most recently completed Execution.
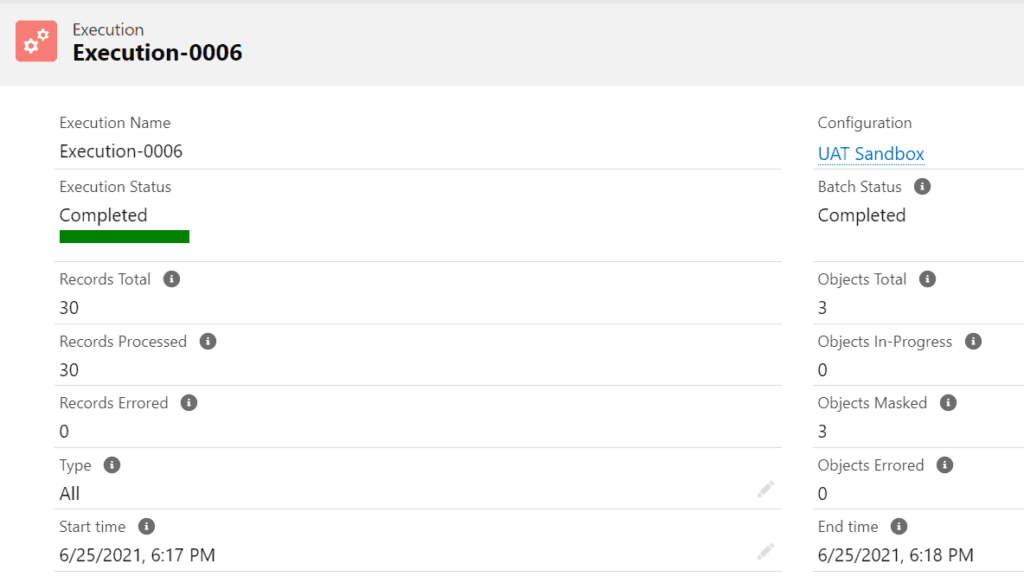
After clicking on the Execution tab, it will display the Execution Details page.
The master object shows a summary of all Execution Logs of the executed Data Masking Configurations.
Execution Log
After opening the execution, the user will see the multiple execution logs that are created, which contain the information on masking.
Execution logs for a specific execution is shown below in the screenshot.
Users will find all performance-related information and Execution Log status here.
Note – In case of retry execution, the user will not see the separate Execution record, DataMasker will update the current Execution after the completion of Retry Execution.
Stop Masking
- Go back to the execution.
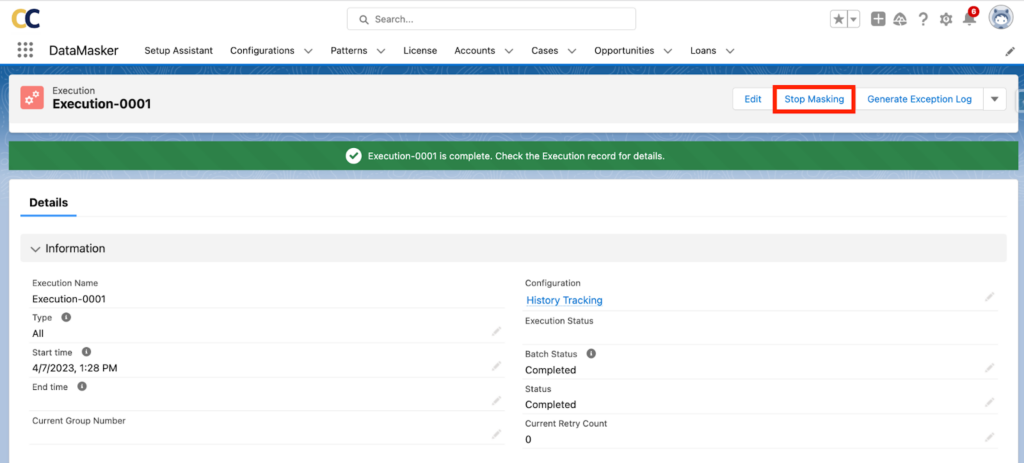
- The Stop Masking button will be shown on the Execution Mobile Lightning Actions, as shown in the screenshot below.
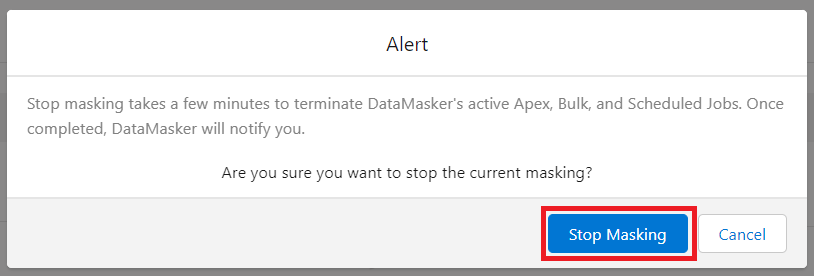
As shown in the above screenshot user can click on the “Stop Masking” button to kill the masking process to solve the issues and again user can initiate the masking process.
Likewise, Stop Masking is an essential functionality that enables the user to save time and quickly restart the masking process without doing any manual intervention to reactivate the things or automation.


